
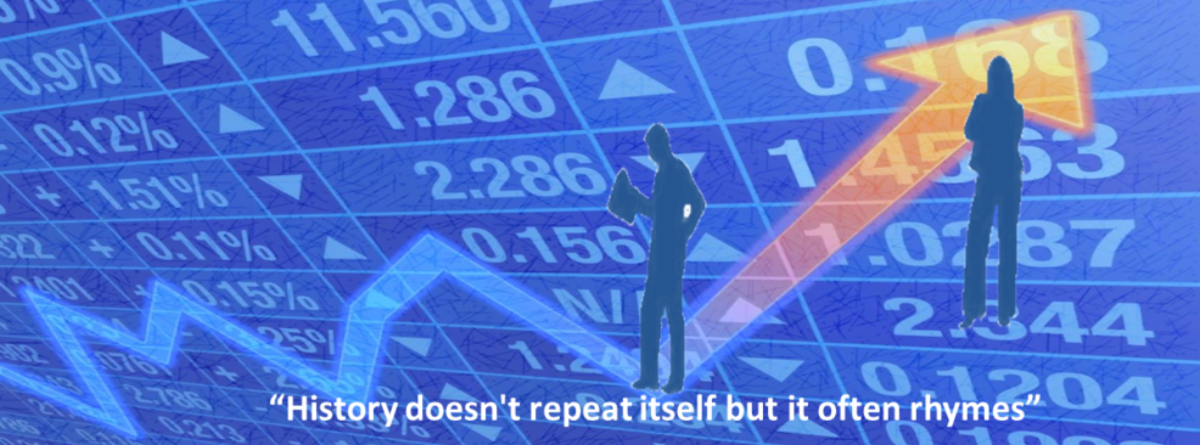
Monthly S&P 500 forecast for August 2026
August 1st, 2026
Our monthly S&P 500 forecast for August is a 2.9 percent increase over the average of July 2026.
The model-based forecast takes into account the changes in oil prices and wages. However, a forecast model cannot possibly capture the full impact of uncertainty caused by tariff wars and geopolitical tensions, such as the war in the Middle East.

A sideways market in July
Market optimism that dominated the second quarter somewhat evaporated in July with renewed hostilities in the Middle East. Traffic in the Straight of Hormuz is down 80%-90%, and oil prices have been rising.
The US economy has not shown clear signs of weakening, as the labor market remains resilient and GDP growth, despite slowing, remains respectable by historical standards.
The new Fed Chairman, Kevin Warsh, chaired his second Federal Open Market Committee (FOMC) meeting in July and kept interest rates unchanged. Emphasizing his commitment to price stability once again, Warsh hinted that rising 10 Year US Treasury yields are doing some of the heavy lifting that an increase in the reference rate would do. 10 Year US Treasury Yields climbed to 4.74 % at the end of July from 4.42%. Indeed, tech companies are currently using the bond market to fund investment in data centers, power infrastructure, and hardware. There has been a massive long-dated bond issuance by companies such as Amazon, Meta, Alphabet, and Microsoft to fund the planned capex of $7.6 trillion over the next 5 years.
AI Boom and the ‘Magnificent 7’
Fed Chair Kevin Warsh’s hawkish stance and the renewed geopolitical tensions made investors uneasy in July. On average, the S&P 500 index was rather flat in July, only up 0.4% from the average of June. As the Q2 earnings season started in July, the earnings of the ‘Magnificent 7’ were a mixed bag. Some, such as Microsoft and Amazon stocks, rallied as they could already show some return on their AI investment. Meta, Tesla, Alphabet and Apple had cooler reactions from investors. Nvidia is expected to report in August.
One thing is becoming evident: The S&P index appeared to be overvalued for quite some time by historical standards. However, markets are realizing now that the earnings potential of the AI-fuelled boom cannot be judged by the historical trajectory of company earnings. Indeed, thanks to the low-hanging fruit of the AI revolution, productivity and profit margins of most companies in the S&P 500 have been increasing. However, a sharp revival of inflation and higher Treasury and credit spreads may put a damper on this rosy scenario. If big tech struggles to pay back its bond obligations, the systemic risk to the economy would be tremendous.
The graph below shows that the spreads on the AA-rated bonds have lately gone up as the 10 Year US Treasury yields have risen. Incidentally, AA2 and AA3 are Moody’s ratings of the bonds issued by Google and Meta, respectively. Currently, there is no reason for concern, but future higher inflation and even higher Treasury yields may put tech companies under pressure in paying their coupon payments.

PMI improves, and consumer confidence deteriorates
The Chicago Purchasing Managers’ Index (PMI) increased to 57.6 in July from 56.7 in June, above market expectations of 56. The increase was driven by a revival in new orders, which reached their highest level since January 2022.
The Conference Board’s consumer confidence index decreased by 1.4 points to 90.8 (1985=100) in July, down from an upwardly revised 92.2 in June. The Present Situation Index—based on consumers’ assessment of current business and labor market conditions—fell by 3.6 points to 114.9, its third consecutive monthly decline. The Expectations Index—based on consumers’ short-term outlook for income, business, and labor market conditions—remained unchanged at 74.7. The survey period for this month’s preliminary results was July 1–22.
Already in June, US consumers were feeling pessimistic about the prospects of getting a job. This was when the US-Iran ceasefire was in place. The violation of the ceasefire and the renewed hostilities contributed to the deterioration in consumer sentiment.
Inflation falls, and Q2 GDP growth slows down
The annual inflation rate in the US fell to 3.5% in June from 4.2% in May 2026. This was below market expectations of 3.8%. Energy costs declined by 5.7% after increasing by 3.9% in May, thanks to the ceasefire between the US and Iran. However, the renewed conflict and the rising energy prices in July indicate that the cooling in US inflation will be short-lived.
Personal consumption expenditures (PCE), a key barometer of inflation and consumer spending, slowed to a 3.7% annual pace in June, down from 4.1% in May, in line with the consensus estimate.
Core PCE, which excludes the more volatile food and energy categories, edged down to 3.3% in June from 3.8% in May, also in line with market forecasts.
US Q2 gross domestic product (GDP) grew at an annualised rate of 1.5 per cent, down from 2.1 per cent in the first quarter. This was the advance (first) estimate for Q2. The reading was below economists’ expectations of 2.1 per cent, making it the weakest pace of growth in more than a year (Source: Bureau of Economic Analysis (BEA)).
Fed kept the rates unchanged in July
After the 25 bp rate cut in December 2025, the Fed’s target range for interest rates is 3.50% to 3.75%.
As Kevin Warsh had his second meeting in July as the new Fed Chairman, he continued to stress his commitment to lowering inflation to the Fed’s target rate of 2 %,
Energy prices have increased about 20 percent with the renewed hostilities in the Middle East. Despite the cooler June inflation, consumer prices will likely remain elevated at least in Q3. Therefore, we believe that given the resilience of the labor market, a rate increase in September may be a likely outcome. In the post-pandemic period, the Fed’s monetary tightening was criticised for being too slow, leading to a prolonged period of elevated prices. It is unlikely that Warsh would repeat the same mistake.
S&P 500 index is fairly valued
According to FactSet Insights from July 31, the forward 12-month P/E ratio for the S&P 500 is 19.6. This P/E ratio is below the 5-year average (19.9) but above the 10-year average (19.0). For Q2 2026, the blended (year-over-year) earnings growth rate for the S&P 500 is 47.4%. If 47.4% is the actual growth rate for the quarter, it will mark the highest earnings growth rate reported by the index since Q2 2021. Overall, the index is close to fair valuation, owing to high earnings forecasts, driven by the AI revolution.
Our monthly S&P 500 forecast is a model-based fair-value estimate. Announcements of tariffs and cancellations cannot be captured in our model unless the impact appears in historical data. The possible impact of geopolitical tensions is fed into the model through keyword searches (Google clicks) and the advanced retail sales index. However, these variables perform better in normal times. Our quarterly S&P 500 forecast discusses these issues in more detail.
